


Friday, 4:40 pm
An online store deploys a small change: a discount-code widget in the order summary. The homepage loads fast, and the uptime monitor gets an HTTP 200 every minute and stays green.
A customer adds products to the cart, chooses a delivery option and clicks "Place order". Nothing happens. The button looks normal, but a transparent element from the new widget covers it. Every click lands on that element instead of the button.
A similar problem can happen when the button responds but doesn't take the customer to payment. A test gateway key was left in the configuration, or new security settings block the redirect. The customer sees a moment of loading and stays on the order summary.
Over the weekend, nobody on the team tries to place an order. On Monday at 9:00 am, someone notices there hasn't been a single purchase since Friday.
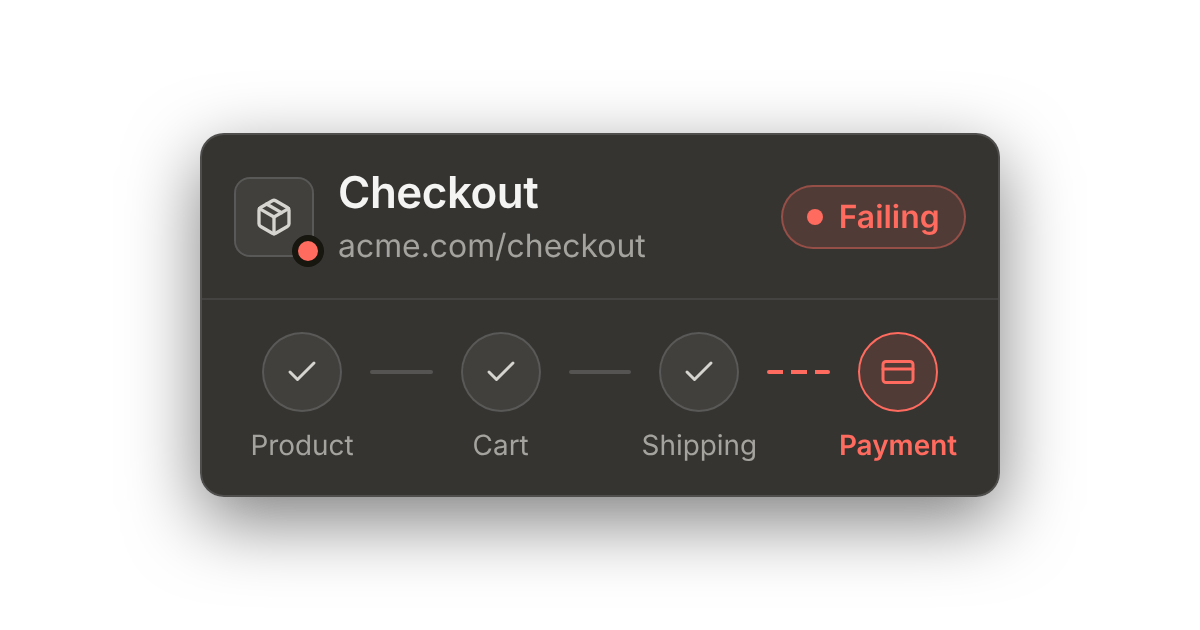
The server was up all weekend. The checkout flow was not. A 200 status code didn't mean a customer could pay. A test that goes through the cart every five minutes, clicks the button and checks that the payment gateway opens could have caught the problem on Friday at 4:45 pm.
Uptime monitoring vs user journey monitoring
Both kinds of monitoring run in production and send an alert when something is wrong. They check very different things, though.
| Uptime monitoring | User journey monitoring (synthetic) | |
|---|---|---|
| The question it answers | Is the site responding? | Can a customer complete a purchase, sign in or submit a form? |
| How it checks | Sends an HTTP request to one address | Starts a browser and goes through a recorded scenario step by step |
| What it sees | Status code, response time, SSL certificate | What the customer sees: buttons, forms, content, redirects, third-party services |
| What it misses | A JavaScript error, a covered button, a broken payment | Problems in flows you haven't recorded |
| Upkeep | Set it up once and it keeps running | The scenario occasionally needs updating after site changes |
You don't pick one instead of the other. Uptime monitoring is the fastest way to learn that the site is down, but only journey monitoring tells you customers can't pay.
What breaks while the server returns 200
Every one of these slips past an uptime monitor:
- A JavaScript error stops the "Continue" button from doing anything.
- An invisible element sits over the button and catches the click, for example the transparent layer of a chat widget or a pop-up backdrop the script never removed.
- The button works but never reaches the payment gateway: the gateway's API key expired, a test key was left in production after a release, new security headers (Content Security Policy) block the gateway's address, or the request that creates the payment fails and the page doesn't show the error.
- A third-party service doesn't load: the CAPTCHA, the pickup-point map, the shipping cost calculator.
- The form rejects valid input because validation rules changed.
- An SSL certificate expired on a resource served from another domain, such as a script CDN, and the browser blocks it.
- After a translation update, the button has a different label or the price disappears.
- After sign-in, the page keeps redirecting between the sign-in page and the account, so the customer never reaches their dashboard.
What they have in common: only someone, or something, going through the flow in a browser sees the problem.
Which flows should you monitor first, and how often?
Journey monitoring doesn't have to cover your whole site from day one. The first scenario, recorded on the flow that makes you money, gives you the most. To find it, ask one question: if this flow were broken for 48 hours, what would it cost us?
The answer also tells you how often to run the browser test. The more an hour of downtime costs, the sooner you want to know about it.
| Flow | Examples | How often to run the test |
|---|---|---|
| The one that makes you money | Cart and checkout up to the payment page, buying a subscription | Every 5 minutes |
| Account access | Sign-in, password reset | Every 15 minutes |
| Getting new customers | Sign-up, trial start, contact form | Hourly |
| Everything else | Search, product filters, newsletter sign-up | Every 6 hours or daily |
Start with one scenario on your most important flow, and run it after every release too. When it has run for a week without false alarms, add the next one. Five flows recorded in a hurry produce more false alarms than one set up properly.
This schedule is for browser tests. An uptime check on your homepage can run alongside it as often as every minute, because it is much lighter.
Three ways to do user journey monitoring
They all come down to the same thing: someone, or something, regularly goes through the flow like a customer and tells you when it breaks. They differ in who does it and how much work it takes.
1. By hand
Someone goes through the checkout every morning or after every release, ticking off each step of a test case in TestRail. That works for one flow on weekdays. It doesn't work at night, at weekends, or when that person isn't available.
2. In code
A developer writes a test in Playwright, Cypress, Selenium or Puppeteer. Here is one in Playwright:
import { test, expect } from '@playwright/test';

test('checkout reaches the payment step', async ({ page }) => {
  await page.goto('https://shop.example.com/product/mug');
  await page.getByRole('button', { name: 'Add to cart' }).click();
  await page.getByRole('link', { name: 'Cart' }).click();
  await page.getByRole('button', { name: 'Checkout' }).click();
  await expect(page.getByRole('heading', { name: 'Payment' })).toBeVisible();
});
If you have a developer who already writes Playwright tests, this is a good route. On top of the test itself you need a schedule (for example a cron job in GitHub Actions), alerting, somewhere to keep screenshots, and someone to fix selectors every time the page changes.
3. In the cloud
Instead of your own code and servers, you use a ready-made platform in the cloud. You record or describe the flow once, and the platform runs it in a real browser on a schedule, from the location you pick. Scheduling, alerts, screenshots and run history live in one place, so you don't have to build or maintain them.
Some tools expect you to write tests in code, while others let you record a scenario by clicking, with no programming. The second approach works well when someone outside the development team looks after the flows, such as the store owner or the marketing team.
What it looks like in TestCLIX
- Record the flow in a browser that runs in the cloud and streams to your screen. No extensions, no code. You click the way a customer would.
- Add checks. Specify what must be visible at a given step, for example the "Payment" heading. If it isn't there, the test reports a failure.
- Pick a schedule. Decide how often the test runs: as often as every 5 minutes or as rarely as once a day.
- Choose a location. The test connects to your site from a server in Europe or the US.
- Set the alarm threshold. For example, raise an alarm when 2 of the last 3 runs fail. A single network hiccup won't wake anyone at 3 am.
- Choose where alerts go: email, Slack, Telegram, Jira or a webhook.
When a run fails, the Session Player replays it step by step next to the recorded reference. You see the same screen a customer would have seen.
Beginner pitfalls
- Don't place real orders. End the test on the payment page, before the final click.
- Content that changes. Prices, dates and recommendations change on their own. Exclude them from the screen comparison (ignored zones) or check them with the AI Assistant instead of exact text.
- Passwords and 2FA. Keep passwords in project secrets, not in the test itself. TestCLIX can generate one-time codes (TOTP) during the run.
- Over-sensitive alarms. Alerting on a single failed run quickly teaches the team to ignore alerts.
When this is not enough
- Journey monitoring doesn't replace testing before a release. It catches problems in production after they happen, within minutes rather than days.
- It checks the flows you chose, not every variant. With five payment methods, the test usually covers one.
- It won't tell you how many customers hit the error. That is the job of error tracking (for example Sentry) and analytics.
- In TestCLIX a test runs from one location. To cover several regions, copy the test and pick another location. We test websites, not native apps.